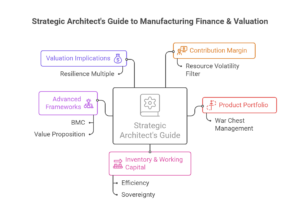

Forging Value: A CFO’s Guide to Manufacturing Finance & Valuation
A Concise Guide to Manufacturing Companies
Welcome
Introduction
For over 25 years, I’ve served as a CFO across diverse manufacturing settings, watching how cost structures, product mixes, and working capital decisions shape both daily operations and long-term success. This series shares those lessons—insights on refining finances, broadening product portfolios, and building resilience in an ever-shifting market.
A strong manufacturing sector underpins economic growth—creating jobs, sustaining supply chains, and fueling local communities. Through proven CFO tactics, we’ll explore how manufacturers can stay competitive and innovative, even as market forces evolve.
Manufacturing also serves as a fertile ground for value creation, from raw materials to final assembly. By applying frameworks like the Business Model Canvas and Value Proposition Canvas, forward-thinking companies can pinpoint new opportunities, boost margins, and achieve sustainable growth.
Manufacturing businesses face unique challenges—from product mix complexities to capital-intensive operations—that standard P&L statements often fail to illuminate. As a CFO with 25+ years in the manufacturing industry, I’ve observed recurring pain points that hamper decision-making and undervalue strategic potential. This two-part blog series explores key financial insights and valuation strategies for manufacturing SMEs, offering a blueprint for long-term resilience and profitable growth.
- Goal of This Series:
- Provide practical CFO tips that cut through accounting jargon.
- Show how modern frameworks (Business Model Canvas, Value Proposition Canvas) elevate manufacturing strategy.
- Highlight how working capital, inventory, and product mix shape true enterprise value.
Topics in Part 1
- Importance of Contribution Margin Analysis.
- Why traditional P&L is insufficient for effective decisions.
- Product portfolio management akin to an investment portfolio.
- Life-cycle diversification for risk reduction and growth synergy.
- Building a one-page strategic dashboard to track customers, products, and success factors.
(We’ll tackle advanced valuations, business model canvases, working capital traps, etc., in Part 2.)
“Blog 1: Driving Profitability & Strategic Clarity in Manufacturing: A CFO’s Perspective”
- Contribution Margin Analysis
1.1 Why CM Trumps Traditional Gross Profit
- Definition: Contribution margin = (Sales Price per Unit – Variable Cost per Unit).
- In manufacturing, “Variable Cost” includes raw materials, direct labor (if it scales with output), and production overhead that changes with volume.
- Why CM Matters: It spotlights how each product contributes to fixed overhead coverage and eventual profit. A product with a decent gross margin but heavy variable costs (or suboptimal labor usage) might have a weaker actual contribution margin.
1.2 CFO’s Role
- Encourage managers to segregate truly variable costs from fixed overhead. Evaluate each SKU or product line’s margin.
- Decision-Making: Identify underperforming lines that might be draining resources or overshadowed by high-CM lines. This can guide capacity allocation, pricing changes, or cost reduction steps.
1.3 Illustrative Example
- Company A had multiple product SKUs. Traditional statements showed a decent average gross margin. But a deeper CM analysis uncovered that SKU #3 had a low contribution margin, heavily reliant on promotional discounts and expensive materials. By re-pricing or substituting cheaper raw materials, SKU #3’s viability improved drastically.
- Traditional P&L vs. Real-World Decision Making
2.1 Shortcomings of a Standard Profit & Loss
- Allocated Overheads: Manufacturing overhead is often spread across product lines in ways that obscure which products truly carry the load.
- Timing & Accounting Lags: Depreciation schedules, period-end inventory valuations, and other accrual entries can mask near-term cost spikes or hidden inefficiencies.
2.2 CFO’s Tips for a More Accurate View
- Segmented Reporting: Track each product family or line in a mini “contribution statement.”
- Rolling Forecasts: A dynamic approach (monthly or quarterly) reveals how certain lines shift in profitability with raw material price changes or labor adjustments.
- Cash Flow Layer: Pair your P&L with a simplified cash flow perspective—particularly for variable cost fluctuations.
Key Takeaway: The standard P&L might say “We’re profitable,” while a deeper drill-down might reveal certain products are cross-subsidizing money-losing lines.
- Managing Product Portfolio Like an Investment Portfolio
3.1 The Investment Mindset
- Each product line can be seen as an “asset” with a risk-return profile. Some lines yield stable returns (mature, established segments), others are high-risk, high-reward (innovative or newly launched products).
- Like an investment portfolio, diversification across various product lines can mitigate cyclical or market-specific risks.
3.2 CFO’s Role
- Risk Mapping: Evaluate each product’s sensitivity to raw material cost, demand elasticity, or competitor moves.
- Expected Return: Approximate each line’s expected margin or net contribution over a given horizon.
- Portfolio Balancing: Decide if you need to retire certain products that tie up working capital for little contribution, or invest more in an emerging line with strong future margins.
3.3 Real-World Parallel
- Similar to stocks vs. bonds, you might have “Cash Cow” lines (predictable, stable, low growth) and “High-Growth” lines (potentially big margin upsides but more resource-intense).
- Product Life Cycle Mix to Diversify & Reduce Risk
4.1 Life Cycle Stages
- Introduction: High R&D, low volumes, potential negative cash flow.
- Growth: Increasing volumes, better margin leverage, but also fierce competition.
- Maturity: Stable sales, likely good margin, potential for cost leadership.
- Decline: Falling demand or shifts in technology, risk of inventory obsolescence.
4.2 CFO Perspective on Each Stage
- Intro: Manage cash burn, fund R&D carefully.
- Growth: Ensure capacity expansions or additional capital invests are well-timed.
- Maturity: Often the “cash cow” stage—use these surpluses to fund new product introductions.
- Decline: Decide whether to sunset, repackage, or pivot. Watch for hidden costs in leftover inventory or maintenance.
4.3 Strategic Mix
- Having multiple products across different life stages can smooth revenue and lower risk. If one mature product’s margin shrinks, a rising star line might offset it.
5. The One-Page Dashboard for Customers, Products, & CSFs
5.1 Why a Single-Page Summary
Manufacturing CFOs routinely juggle copious data—from raw production figures to multiple P&L statements. Summarizing all these insights on one page lets management instantly see where profitability, demand, or cost pressures might shift. A concise snapshot eliminates the need to sift through endless printouts, facilitating faster, better-aligned decisions across departments.
5.2 Applying the 80/20 Principle (Pareto) in the Dashboard
- Core Concept: In many manufacturing businesses, 20% of products or customers generate 80% of revenue (or contribution margin). By leveraging the Pareto principle, you can quickly highlight the top customers and product lines that drive the bulk of sales or profit.
- Why It Matters: Focusing on the vital few (that 20%) helps you spot critical margin shifts or demand changes early. For example, if a major customer’s volume suddenly drops, it may cause a significant dip in total revenue—even if the overall product portfolio looks okay.
- Dashboard Emphasis: Alongside standard metrics (like on-time delivery or inventory turns), add a Pareto chart or segment to illustrate the top 20% of customers/products. This visual slice ensures those key drivers of profitability aren’t buried in the broader data, allowing the CFO and operations team to take swift action if they see red flags.
5.3 Critical Success Factors (CSFs)
- Examples: On-time delivery rates, main customer order volumes, top product contribution margin (CM), inventory turns, cash conversion cycle.
- Integrating 80/20: Within these metrics, highlight which customers or products make up the top 20% of sales or margin. This approach quickly flags if a few high-impact SKUs or clients experience margin erosion or demand drops.
5.4 Implementation
- Tools: Simple pivot tables in Excel or specialized BI platforms (Power BI, Tableau) can generate a weekly or monthly “scorecard.” Incorporate a Pareto chart to display top contributors in descending order, marking the 80% cutoff visually.
- CFO Tip: Keep the visual design minimal—use color coding or “red flags” for anomalies. By periodically reviewing whether the top 20% still produces 80% of results (or if that ratio shifts), the leadership team can refine sales strategies, pricing, or capacity allocation before problems scale.
Key Takeaway: A single “Monday Morning Scorecard” that applies the Pareto principle provides a powerful lens on your critical products and customers, ensuring the vital few get the attention they deserve. This blend of essential KPIs and 80/20 focus helps unify cross-department communication, accelerate corrective actions, and protect the core drivers of profitability.
.
Conclusion
Recap:
- Contribution margin analysis uncovers real product profitability.
- Standard P&L statements can mislead operational decisions.
- A portfolio mindset and life cycle mix approach reduce risk.
- A one-page strategic dashboard helps leadership track key metrics—leading to sharper, quicker decisions.
In the next blog, we’ll delve deeper into Business Model Canvas and Value Proposition Canvas for manufacturing, address inventory & working capital pitfalls, and show how CFO-level insights can boost valuations by managing product lines effectively.
“Elevating Manufacturing Valuation & Strategy: A CFO’s Playbook (Part 2)”
Introduction
In Part 1, we explored the financial building blocks that every manufacturing CFO should master: from contribution margin to the life cycle mix. Now, we pivot to advanced frameworks (Business Model Canvas, Value Proposition Canvas) and the crucial roles of inventory and working capital. We’ll also highlight common valuation traps, especially when maturing product lines throw off deceiving levels of cash flow.
1. Business Model Canvas for Manufacturing
1.1 Mapping the BMC
- The 9 blocks: Key Partners, Key Activities, Key Resources, Value Proposition, Customer Segments, Channels, Customer Relationships, Cost Structure, Revenue Streams.
- In manufacturing, Key Activities might include sourcing raw materials, production runs, quality control, distribution. Key Resources can be specialized machinery, patents, or skilled labor.
1.2 CFO’s Perspective
- Cost Structure: Distinguish fixed vs. variable, highlight high-capex items.
- Revenue Streams: Evaluate if a B2B arrangement with a few giant clients leads to revenue concentration risk.
- Partner Ecosystems: Suppliers, logistic alliances—CFOs must watch potential supply chain bottlenecks or single supplier vulnerabilities.
1.3 Example
- A mid-sized electronics manufacturer mapped their BMC, discovered reliance on a single overseas raw material partner. The CFO negotiated a secondary domestic supplier, even at a slightly higher cost, to reduce risk and ensure consistent production schedules.
- Applying the Value Proposition Canvas (VPC)
2.1 VPC Basics
- Identify pains (operational inefficiencies? high scrap rates?) and gains (reduced downtime, lower cost of ownership) for your customer segments.
- Then align your product’s “pain relievers” and “gain creators” accordingly.
2.2 Manufacturing Twist
- Many manufacturing businesses produce components for OEMs. The “Job to be done” might be ensuring a certain quality standard or just-in-time delivery to avoid your customer’s line stoppage.
- CFO angle: If your product truly solves your customers’ biggest manufacturing headache, you can command better pricing or multi-year supply contracts.
2.3 Example
- A packaging manufacturer polled their top customers. Pain point: “Frequent line disruptions.” Gain: “Reliable, on-demand supply with minimal lead times.” By reorganizing production scheduling and buffer inventory, they locked in multi-year deals, stabilizing revenue forecasts for valuation improvement.
- Inventory Management & Working Capital
3.1 Inventory’s Double-Edged Sword
- Insufficient stock = missed sales; too much stock = idle cash + risk of obsolescence.
- CFO tip: Track inventory turnover and aging data. Segment them by product lines so slow-moving SKUs get flagged early.
3.2 Working Capital as a Growth Engine
- In manufacturing, working capital (inventory + receivables – payables) often consumes significant cash. Freeing up even 10% can finance expansions or new product lines.
- CFO approach: Negotiate better payment terms, adopt demand forecasting to keep inventory lean.
3.3 The Pitfall of Maturing Product Cash Flow
- A stable, mature product line might generate strong cash as growth flattens (less reinvestment). But if that product is near decline, this “extra” cash can be misleading for valuations, as future revenue may tail off quickly.
- Advice: Reinvest windfall in new product R&D or mitigate risk via diversification.
- Valuation Implications in Manufacturing
4.1 Distinguish Good Profit from Great Margins
- Some lines might show decent net income, but intangible risk factors (supplier concentration, outdated processes) could reduce the multiple an acquirer is willing to pay.
4.2 Tangible vs. Intangible Assets
- Machinery and real estate are easy to see, but brand reputation, proprietary processes, or intellectual property often matter more in modern manufacturing valuations.
- CFO tip: Document process innovations or R&D achievements that create intangible value—boosting potential exit multiples.
4.3 Normalization of Costs
- If the company owns the facility, “market rent” adjustments might be needed. If the product lines rely on specialized labor or raw materials from a sister company, normalizing those transfer prices is key to a fair valuation.
4.4 Efficient Working Capital
- Efficient use of working capital reduces the risk and, in turn, increases the value of the business. Excess working capital in the form of inventory or AR is discounted in valuation.
Conclusion & Key Takeaways
- BMC & VPC: Provide a strategic blueprint for customer-centric manufacturing.
- Working Capital & Inventory: Must be systematically managed to avoid liquidity crunches and seize growth opportunities.
- Valuation Traps: Over-reliance on a single mature product line, or ignoring intangible assets, can skew perceived value.
- Next Steps: Evaluate your manufacturing portfolio like an investment—using contribution margin, life cycle mixing, and strategic dashboards to ensure each product line’s viability and synergy.
Ready to Act?
If you want personalized CFO advice on optimizing your product lines, managing working capital, or raising your manufacturing firm’s valuation, contact me. With over 25 years in manufacturing finance, I can help shape a robust, future-ready operation.
For a 15-minute free consultation. Email: sanjay@sankulinc.com Phone: 6472977025. www.sankulinc.com www.Businessvaluegrowth.com
© 2025 [Sanjay Kulkarni, Sankul Enterprises Inc.] All rights reserved. This article is protected under copyright laws. Unauthorized copying, reproduction, or distribution is strictly prohibited. For permissions, contact above.
Disclaimer:
The information provided in this article is for general informational purposes only and does not constitute professional advice. While every effort has been made to ensure the accuracy of the information, it may not apply to specific situations. Readers are encouraged to seek personalized advice from a qualified professional regarding their unique circumstances. The author and publisher accept no responsibility for any decisions made based on this content.